


Last updated: October 1, 2026
GPU Break‑Even Calculator
Use our GPU break-even calculator to compare buy vs rent costs by explicitly modeling utilization, CAPEX, electricity, operations, and cloud rates. The tool guides whether purchase or rental makes financial sense for your workload.
How does the GPU break-even calculator work?
The GPU break‑even calculator is a tool that estimates the crossover point at which buying hardware becomes more cost-effective than renting cloud GPUs over a defined planning horizon.
What inputs does the calculator require?
- GPU purchase cost (per unit or full node), including chassis, networking, delivery.
- Estimations of residual resale value or depreciation.
- Electricity cost ($/kWh), power draw, and datacenter overhead (PUE).
- Ongoing ops costs (maintenance, hosting, support).
- GPU utilization: active hours per day/month or % utilization.
- Cloud rental rate ($/GPU-hour) — on-demand, reserved, or spot.
- Analysis timeline (months or years).
These inputs parallel calculators like gpuprice.fyi’s transparent GPU economic calculator (which models CAPEX, power, utilization) ([gpuprice.fyi](https://gpuprice.fyi/calculator?gpu=l40s&utm_source=openai)) and the comprehensive GPU Server Cost Calculator with full TCO breakdown ([gpucost.org](https://gpucost.org/gpu-server-cost-calculator)).
What formula does the calculator use?
At its core, the model compares:
- Cost of renting = cloud rate × number of GPUs × active hours.
- Cost of owning = (capex − residual value) amortized + electricity + ops + hosting.
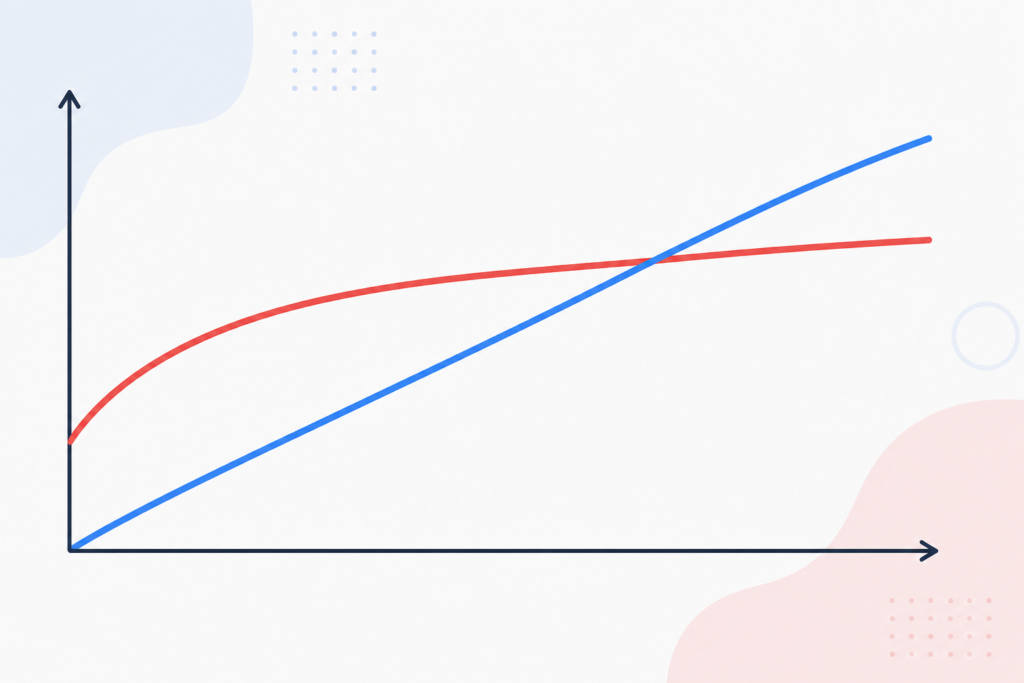
Break-even occurs when cumulative ownership cost equals cumulative rental cost within your selected timeframe.
For example, buying a used H100 at $25,000 vs renting at $2/hr breaks even after ~12,500 hours of usage — or about 17 months of constant usage ([llmblueprint.ai](https://www.llmblueprint.ai/blog/break-even-on-prem-vs-cloud)).
What break-even ranges are typical?
| Scenario | Rent Rate | Break-Even Utilization or Time |
|---|---|---|
| H100 used vs rent @ $2/hr | $2/hr | ~17 months (24/7) ([llmblueprint.ai](https://www.llmblueprint.ai/blog/break-even-on-prem-vs-cloud)) |
| 8× H100 node vs cloud reserved | $98/hr | ~8,556 hours (~12 months) ([gpuaas.com](https://gpuaas.com/blog/gpu-rent-reserve-buy-decision-framework-2026)) |
| 8× H100, hardware $269K, op‑ex $191K/year | $2.69/hr cloud | ~249 GPU-hours/day (~10–11 GPUs) for 5‑year horizon ([deploybase.ai](https://deploybase.ai/articles/on-premise-vs-cloud-gpu-total-cost-of-ownership-analysis)) |
| 8‑GPU H100 node vs hyperscaler cloud | $6.88/hr | ~52% utilization break-even ([io.net](https://io.net/p/gpu-cloud-vs-on-premise-2026-decision-guide)) |
How to use the calculator step by step
- Gather cost inputs: hardware quote, electricity, ops, resale value assumptions.
- Pick your utilization scenario (hours/month or %).
- Enter or fetch current cloud rate per GPU-hour.
- Set your analysis period (e.g., 36 months).
- Run the calculation: the tool shows cumulative cost curves and break-even month.
- Run sensitivity tests: vary utilization, power cost, depreciation, and cloud rate.
This mirrors best practices in calculators like gpucost.org’s TCO tool ([gpucost.org](https://gpucost.org/gpu-server-cost-calculator)) and siliconanalysts’ build-vs-rent tool with utilization thresholds ([app.siliconanalysts.com](https://app.siliconanalysts.com/tools/build-vs-rent)).
What insights can this deliver?
- Utilization threshold: e.g. own only pays off above ~50–60% sustained usage ([app.siliconanalysts.com](https://app.siliconanalysts.com/tools/build-vs-ren)).
- Time to payback: H100 racks may break even in ~12–17 months at full load ([llmblueprint.ai](https://www.llmblueprint.ai/blog/break-even-on-prem-vs-cloud)).
- When rent always wins: modern low-cost decentralized cloud rates (~$2–3/hr) often make on-prem uncompetitive unless utilization is extremely high and ops costs are low ([io.net](https://io.net/p/gpu-cloud-vs-on-premise-2026-decision-guide)).
- Hybrid approach: buy for baseline load, rent for spikes to optimize costs and flexibility ([llmblueprint.ai](https://www.llmblueprint.ai/blog/break-even-on-prem-vs-cloud)).
Tool comparison overview
| Tool | Key Strength | Limitations |
|---|---|---|
| gpuprice.fyi calculator | Live cloud rates, transparent inputs | Limited to GPU-level, excludes staff, taxes ([gpuprice.fyi](https://gpuprice.fyi/calculator?gpu=l40s)) |
| gpucost.org TCO tool | Full TCO, ops, resale value | Requires manual input; not a procurement quote ([gpucost.org](https://gpucost.org/gpu-server-cost-calculator)) |
| siliconanalysts build‑vs‑rent | Utilization break-even analysis | Simpler TCO, less detail in ops breakdown ([app.siliconanalysts.com](https://app.siliconanalysts.com/tools/build-vs-rent)) |
| On‑prem.ai calculator | Estimating GPU demand vs baseline cost | Assumes high-level user model; excludes power/facility ([onprem.ai](https://www.onprem.ai/en/cost-calculator/)) |
Illustration: Visual breakdown of costs
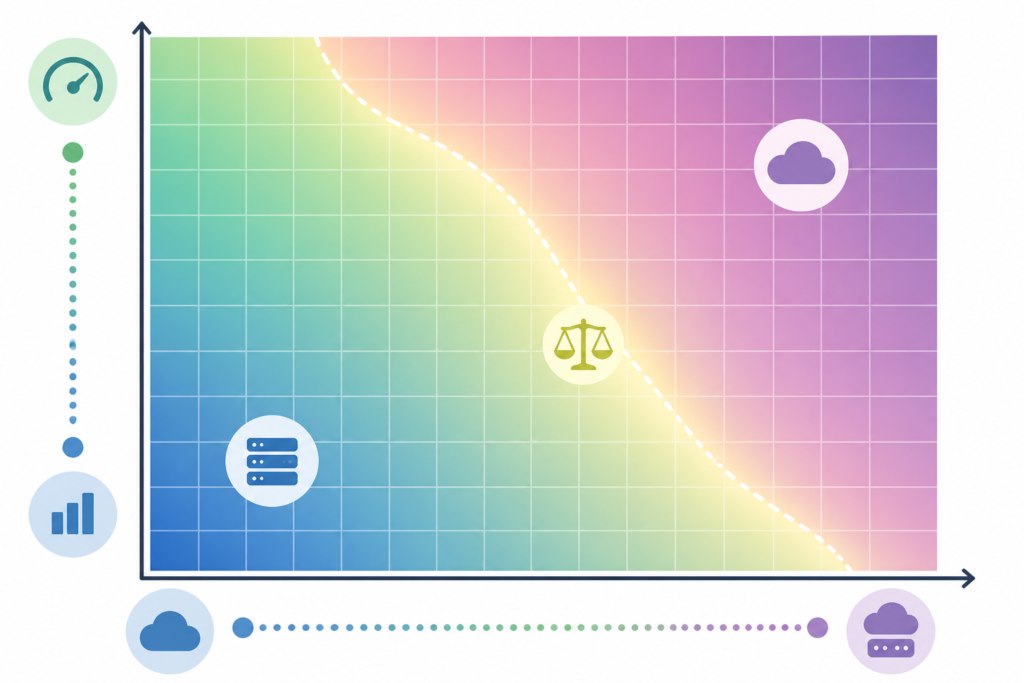
See these two inline illustrations for how cost curves and break-even points behave in realistic scenarios:
Figure 1. Cost-over-time curves for buying vs renting GPUs under different utilization scenarios.
Figure 2. Sensitivity chart showing how break-even shifts with utilization, cloud rate, and ops costs.
When should you trust the calculator—and when not?
The calculator gives a planning estimate, not a precise procurement quote. It omits factors like financing costs, taxes, downtime, staffing variability, cloud spot discounts, tiered pricing, and changing resale markets. Use the results to guide negotiations, but always validate assumptions with vendor quotes and internal cost data.
Frequently Asked Questions
About the Author
Nhon Dang is a cloud infrastructure and operations professional with over 10 years of hands‑on experience in cloud services, infrastructure, and business operations—including GPU infrastructure. He provides practical, experience‑driven guidance to help teams optimize cost and performance.